
College feature · Analytics
Every department, in one live dashboard
From a single student to the whole institution — TedQu rolls daily activity into HOD- and management-ready analytics, from macro trends to micro interventions.
Macro to micro viewsLive institution-wideEvery role, one login
Institution analyticsdepartment-wise
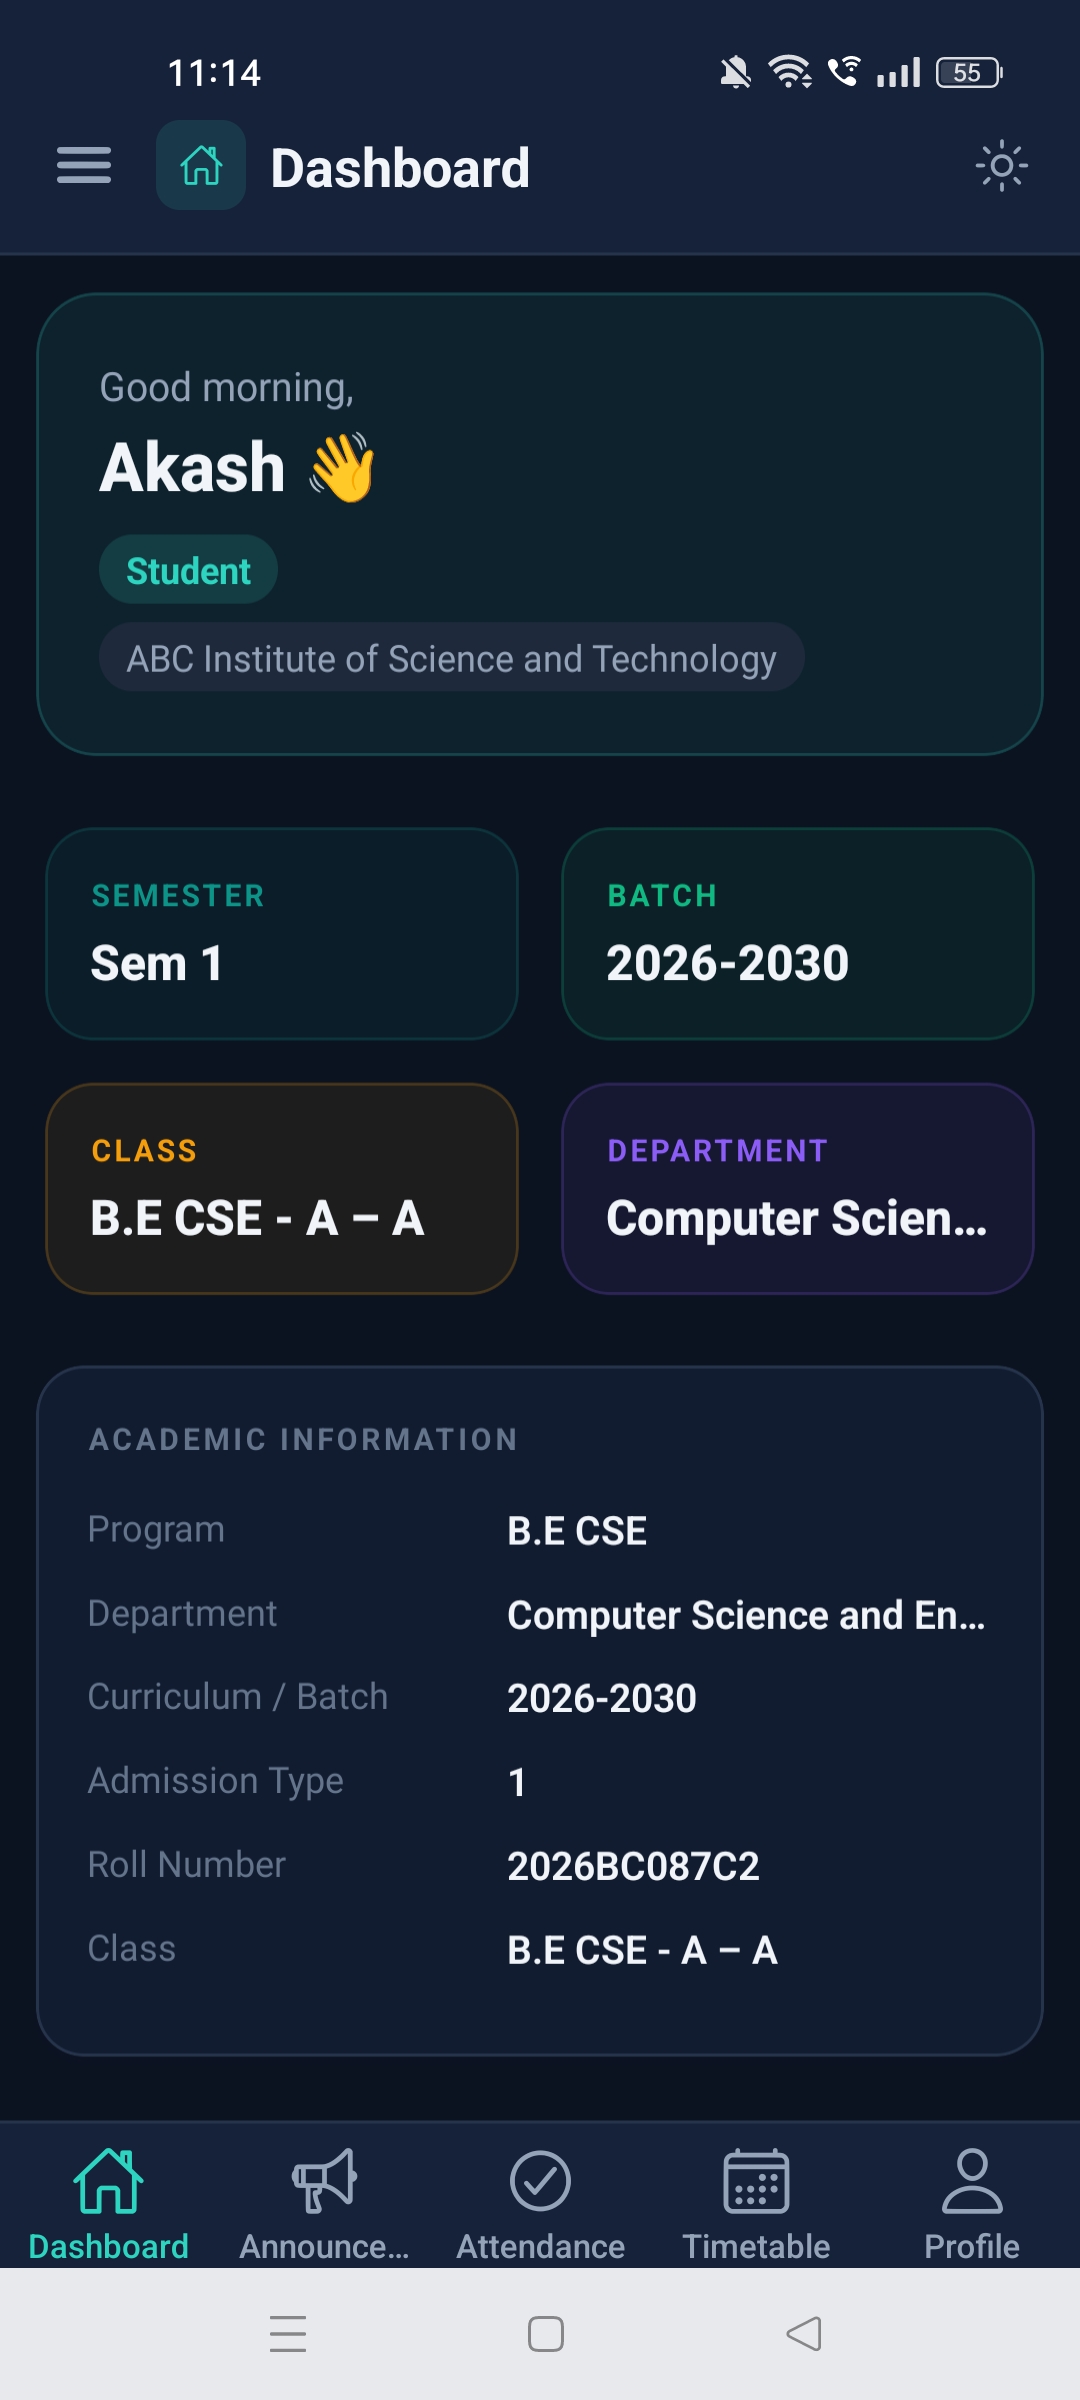
Updated liveno manual merge
The shift
From a dozen spreadsheets to one view
Stop stitching reports together by hand.
The old way
✕Each department reports in its own spreadsheet.
✕Management sees the picture weeks later.
✕Comparing departments means manual merging.
✕Early-warning signals are buried in the data.
With TedQu
✓Every department feeds one live dashboard.
✓Management sees attendance, results and trends now.
✓Compare departments, courses and cohorts instantly.
✓Interventions are flagged before the term slips.
How it works
Macro to micro, in a click
1Capture
Attendance, quizzes and results flow in live.
2Roll up
Data aggregates by course, department, institution.
3Drill down
From whole-campus to a single student.
4Act
Spot the gap and intervene, early.
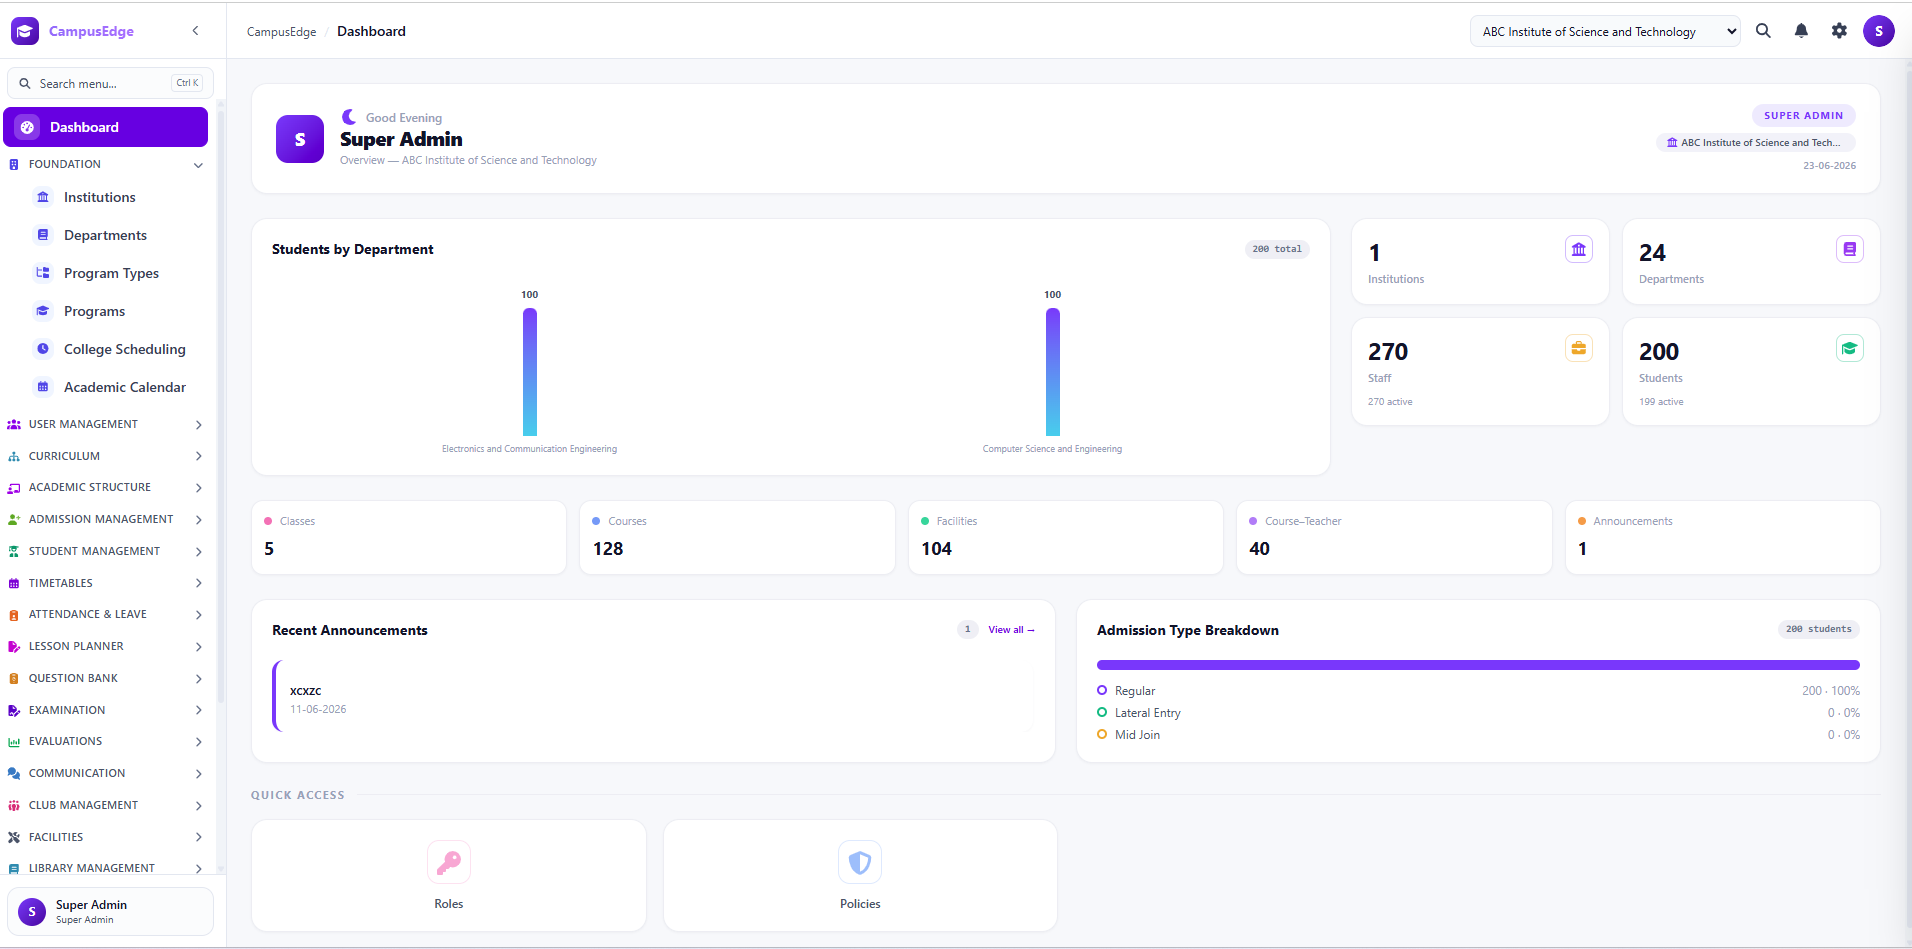
See it in action
From whole-campus to a single student
✓Attendance, pass rates and CGPA, department-wise.
✓Participation, proficiency and teacher-impact metrics.
✓Macro trends and micro interventions, side by side.
Why it matters
Why leadership relies on it
Whole campus
Every department in a single view.
Always live
No manual consolidation, ever.
Early signals
Intervene before small gaps grow.
1live dashboard
Macro→microone click
Everydepartment linked
Explore the suite
More for your campus
See Institution-wide Analytics for your campus
A 30-minute walkthrough, mapped to how you lead.
Book a free demo →